
Analyzed hospital patient records using Power BI to evaluate admissions, readmissions, patient demographics, healthcare costs, and treatment trends. Built an interactive dashboard to transform patient data into clear KPIs and actionable insights for hospital decision-making.

Leveraged Power BI's dashboard capabilities to effectively communicate insights derived from diverse projects, including a focus on pizza sales. Analyzed data to identify the top 5 pizza flavors and pinpoint peak sales days of the week, showcasing a proficiency in extracting actionable information from datasets.

In this project centered on Nashville's housing data, my primary focus was on data cleaning using SQL. I meticulously processed raw datasets, addressing inconsistencies and handling missing values to enhance usability. By ensuring data quality and organization, I set the groundwork for future in-depth analysis and insights extraction.

Using SQL Server, I explored global COVID-19 data spanning [X countries / X rows] to calculate infection rates and death rates relative to population. The queries formed the analytical backbone later used to build the COVID-19 Tableau dashboard, connecting raw case data to a visual, explorable format.
A collection of dashboards built to practice turning varied, real-world datasets into visuals stakeholders can explore on their own. Topics include a COVID-19 case tracker, Airbnb pricing trends, London bike-share usage, top-paid athlete earnings, and library circulation data, each designed to surface patterns without requiring the viewer to touch the raw data.
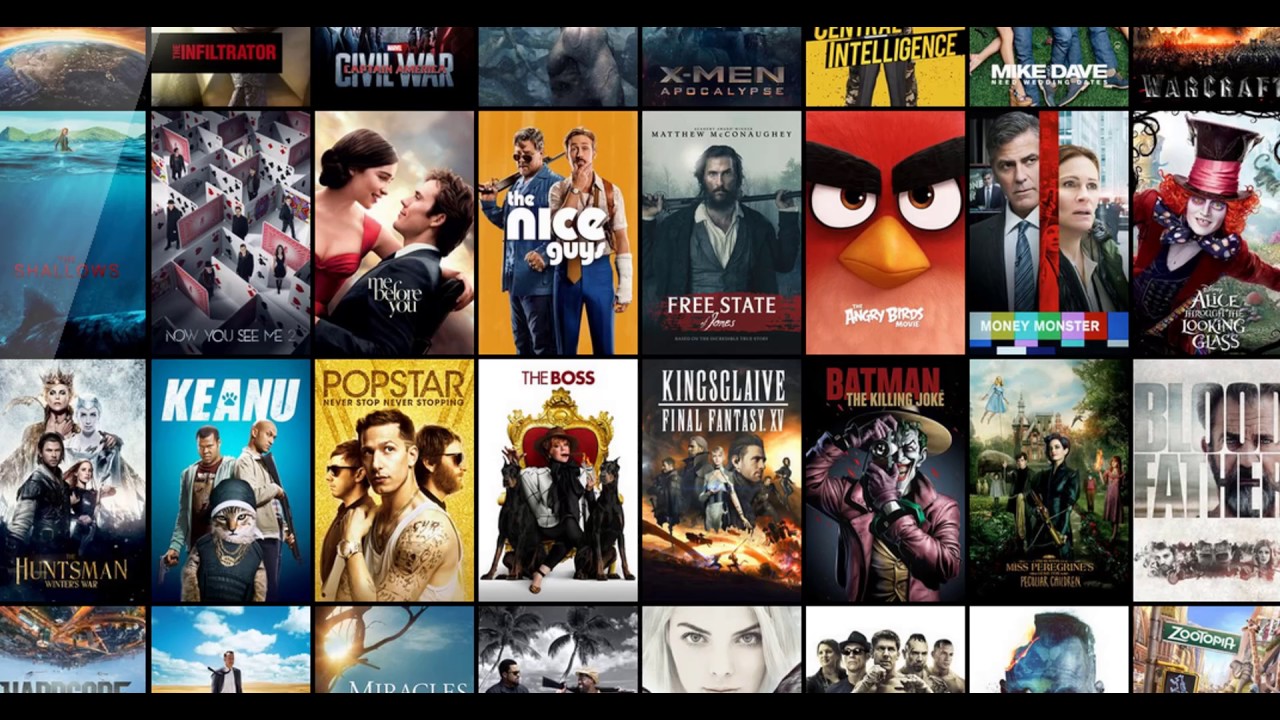
Curious what actually predicts a movie's box office success, I used Python (Pandas, NumPy, Seaborn) to analyze [X movies], testing correlations between budget, release timing, director, and runtime against gross earnings. Budget emerged as the strongest predictor, a finding that shaped how I approached feature selection in later analysis work.